Powering Retail Strategies: Trade Area Power Scores Launch in the UK Market
Proven and trusted in the U.S., Green Street’s Trade Area Power (TAP) Scores have become a go-to benchmark for assessing the local demographic strength of an asset, with TAP scores referenced in our research notes widely to support analysis of assets. Now, this powerful tool is set to launch in the UK, within Retail Analytics Pro, allowing users to gain a powerful new data metric for understanding location quality.
Investors, brokers, and retailers alike have long relied on demographic data to guide decisions, from evaluating asset quality to understanding catchments. However, processing this information and making cross-market comparisons can be challenging. Green Street’s TAP Scores simplify this by combining income, population density, educational attainment, and housing affordability into a single score, from 1 to 100, that captures the demographic strength of a location. This standardised metric helps identify comparable catchments, benchmark new sites, and forecast sales performance with greater confidence.
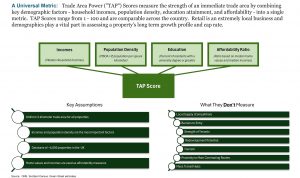
Here’s a look at the four core demographic metrics behind the score and why they matter.
Household Income
Median household income is a critical indicator because it directly reflects the local population’s spending power. Areas with higher incomes can typically support a stronger mix of tenants, including premium retailers, which often generate higher sales productivity. Wealthier catchments are generally more insulated from economic downturns and can offer more stable rental income and long-term asset performance. It also informs decisions about tenant mix, rent levels, and investment strategy, helping to align the asset with the needs and expectations of its local customer base.
Population Density
Population density indicates how many people live within a defined area. High density means more potential customers nearby, supporting steady footfall for retail tenants. Higher population density signals the opportunity for stronger sales volumes and tenant demand, making it a key measure of a location’s consumer base.
Education Attainment
Areas with a higher share of graduates often have stronger job markets, particularly in professional sectors, which can drive higher income levels. A higher percentage of degree-holders often correlates with higher discretionary spending levels, and a stable employment base that is resilient to economic shocks. This creates retail destinations that can generate above average spending levels which create better investments for landlords and strong performing stores for retailers.
Affordability
The affordability ratio (calculated as median home value over median household income) captures the cost-of-living pressure in an area and gives a simple snapshot of how affordable housing is relative to local earnings, while also gauging whether local consumers have room for non-essential spending.
For most households, housing is by far the biggest single expenditure. In places where the affordability ratio is high, a larger share of household income goes toward housing costs, leaving less disposable income. While high house prices can reflect desirability, if they significantly outpace incomes, they may limit household spending power.
By combining these four powerful metrics, we get a clear picture of local demographic strength. TAP Scores offer a clear, data-driven view of local demographic quality, helping clients make smarter and faster decisions.
Click here to learn more about Green Street's new
Retail Analytics Pro
Learn more about our insights
Our thought leadership helps thousands of clients make better investment decisions every day. Inquire here to learn more about Green Street’s product suite.
More Stories
Retail Sector
Retail Recovery: FY 2024 Store Openings and Closures – PwC report driven by Green Street Data
Retail Sector
Measuring Retail Success: Why Floorspace is a key data point?
Retail Sector